In the 2025 IT030 table, 52.7% of enterprises with 10–19 persons employed bought cloud services, compared with 93.7% of those with 250 or more. The difference is 41.0 percentage points. This comparison covers enterprises in the Statistics Estonia survey, not all small businesses. Here we examine five measures across five size groups and explain what the figures do and do not establish.
1. The question and the population
The question is narrow: how does the reported purchase of cloud services differ by enterprise size in Estonia in one reference year? We selected 2025, activity TOTAL and the EMTAK 2008 classification from Statistics Estonia table IT030. The source describes enterprises with at least 10 persons employed and observations at the beginning of the year. The categories are 10–19, 20–49, 50–99, 100–249 and 250+ persons employed.
An owner-only business or a company with fewer than ten persons employed is outside this comparison. We do not combine the first two groups into a new average, and we do not treat the table as a survey of every business in Estonia. The five measures are purchases of any cloud service, email, office software, file storage and CRM as cloud services.
2. The complete selected table
Values are percentages of enterprises in the relevant size and activity group, using the original Estonian denominator note. The official total is supplied by Statistics Estonia; it is not the simple mean of the five group percentages.
Scroll sideways to see every column.
| Indicator | 10–19 | 20–49 | 50–99 | 100–249 | 250+ | Official total |
|---|---|---|---|---|---|---|
| Any paid cloud service | 52.7 | 63.1 | 80.1 | 85.6 | 93.7 | 61.3 |
| 47.5 | 55.1 | 70.3 | 78.2 | 89.7 | 54.7 | |
| Office software | 43.1 | 52.7 | 67.8 | 78.6 | 89.7 | 51.5 |
| File storage | 43.9 | 50.6 | 68.3 | 74.9 | 89.1 | 51.1 |
| CRM | 9.5 | 10.3 | 22.7 | 26.7 | 39.1 | 12.6 |
Email, office software and file storage have separate rows, but their users overlap. Adding those percentages does not give a number of unique customers. CRM here means CRM purchased as a cloud service; it does not measure every form of customer management, every on-premises system or the quality of a firm's sales process.
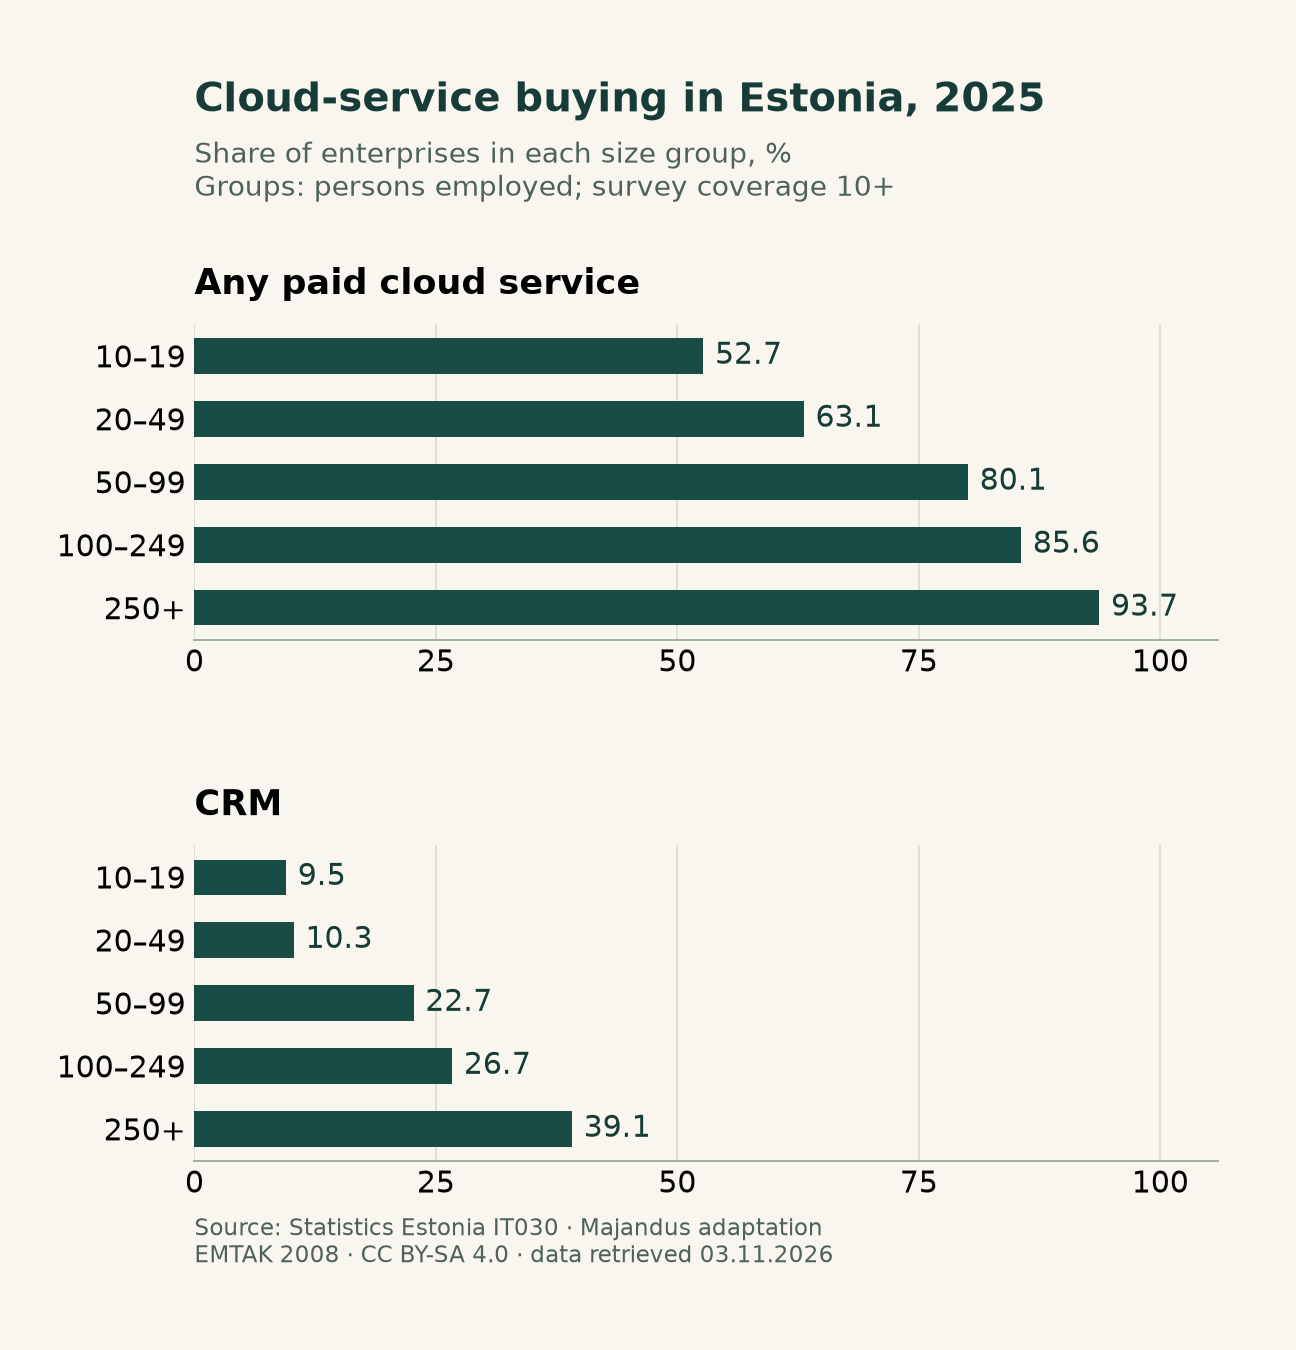
The chart shows two of the five measures for readability. All five are available in the table and downloadable data.
3. Compare gaps in percentage points
We calculated each difference as the share in the second named group minus the share in the first. The units below are percentage points, not percentage growth and not an estimated productivity effect.
Scroll sideways to see every column.
| Indicator | 250+ minus 10–19 | 250+ minus 20–49 | 20–49 minus 10–19 |
|---|---|---|---|
| Any paid cloud service | 41.0 | 30.6 | 10.4 |
| 42.2 | 34.6 | 7.6 | |
| Office software | 46.6 | 37.0 | 9.6 |
| File storage | 45.2 | 38.5 | 6.7 |
| CRM | 29.6 | 28.8 | 0.8 |
For any cloud service, 93.7 minus 52.7 gives 41.0 percentage points between the 250+ and 10–19 groups. For cloud CRM, 39.1 minus 9.5 gives 29.6 points. Office software has the largest absolute gap between these two groups among the five selected measures: 46.6 points. The smallest of those five gaps is cloud CRM at 29.6 points. These are descriptions of the selected figures, not tests of statistical significance.
The adjacent 10–19 and 20–49 groups differ by 10.4 points for any service and 0.8 points for cloud CRM. A small absolute difference in one measure does not establish that the groups are equivalent, that their needs are identical or that either group should buy a particular product.
4. A source-language discrepancy readers need to see
The saved PX export contains conflicting denominator notes. Its original Estonian note says the share is among all enterprises, while the English note refers to enterprises that have not bought cloud services. We follow the explicit Estonian original and disclose the conflict instead of silently reproducing the English wording. The downloadable analytical dataset records this decision.
The source's explicit PX update is 15 September 2025, 08:00. A separate JSON-stat updated field contains a year-9999 placeholder, so we do not use that field as a publication date. The analysis was prepared from the extract retrieved on 3 November 2026. The observation year remains 2025. The source also points to IT0300 for later classification continuity following the move to EMTAK 2025; no later series is spliced into this comparison.
5. How the comparison was reproduced
We saved the exact query, metadata and official response in JSON-stat and PX formats. All 30 values matched across those two formats: 25 group values plus five official totals. This cross-format check tests extraction consistency; it is not confirmation from a second independent survey. No selected cell was missing. We checked the 0–100 range, indicator codes and two differences manually, then calculated the 15 predefined differences with decimal arithmetic.
The source uses special markers for confidential and unavailable observations. None appears in the selected cells, but such a marker must remain missing in any extension of the dataset. It must not be converted into zero. We did not calculate confidence intervals, pool size groups or estimate company-level outcomes.
6. What an owner can take from the results
The snapshot establishes differences in reported buying across the selected groups. It does not explain why a company bought a service, how well it uses it or whether it earns more as a result. Size groups can differ in sector mix and operating requirements; this table does not isolate those effects. A causal story about software producing business growth would require different evidence.
Use the table to make a more precise question, such as which part of customer work needs a shared record. Our handover checklist addresses that operational decision, while the first-month workflow plan shows how to examine one process before extending a change. Neither starts from the assumption that software buying is itself a successful implementation.
7. Data, attribution and sources
- Download the selected data, query and all 15 comparisons as JSON.
- Download the original official JSON-stat response.
- Statistics Estonia IT030: source table.
- Statistics Estonia 20505: definitions and survey methodology.
Source: Statistics Estonia, IT030, 2025, retrieved 3 November 2026. Majandus selected the measures, calculated differences and created the chart. The adapted data table, calculated differences and chart are shared under CC BY-SA 4.0, with changes identified here. This is secondary analysis of official open data, not a new survey conducted by Majandus.